
Erhältlich:Nicht auf LagerBuch (Softcover): Fachbuch
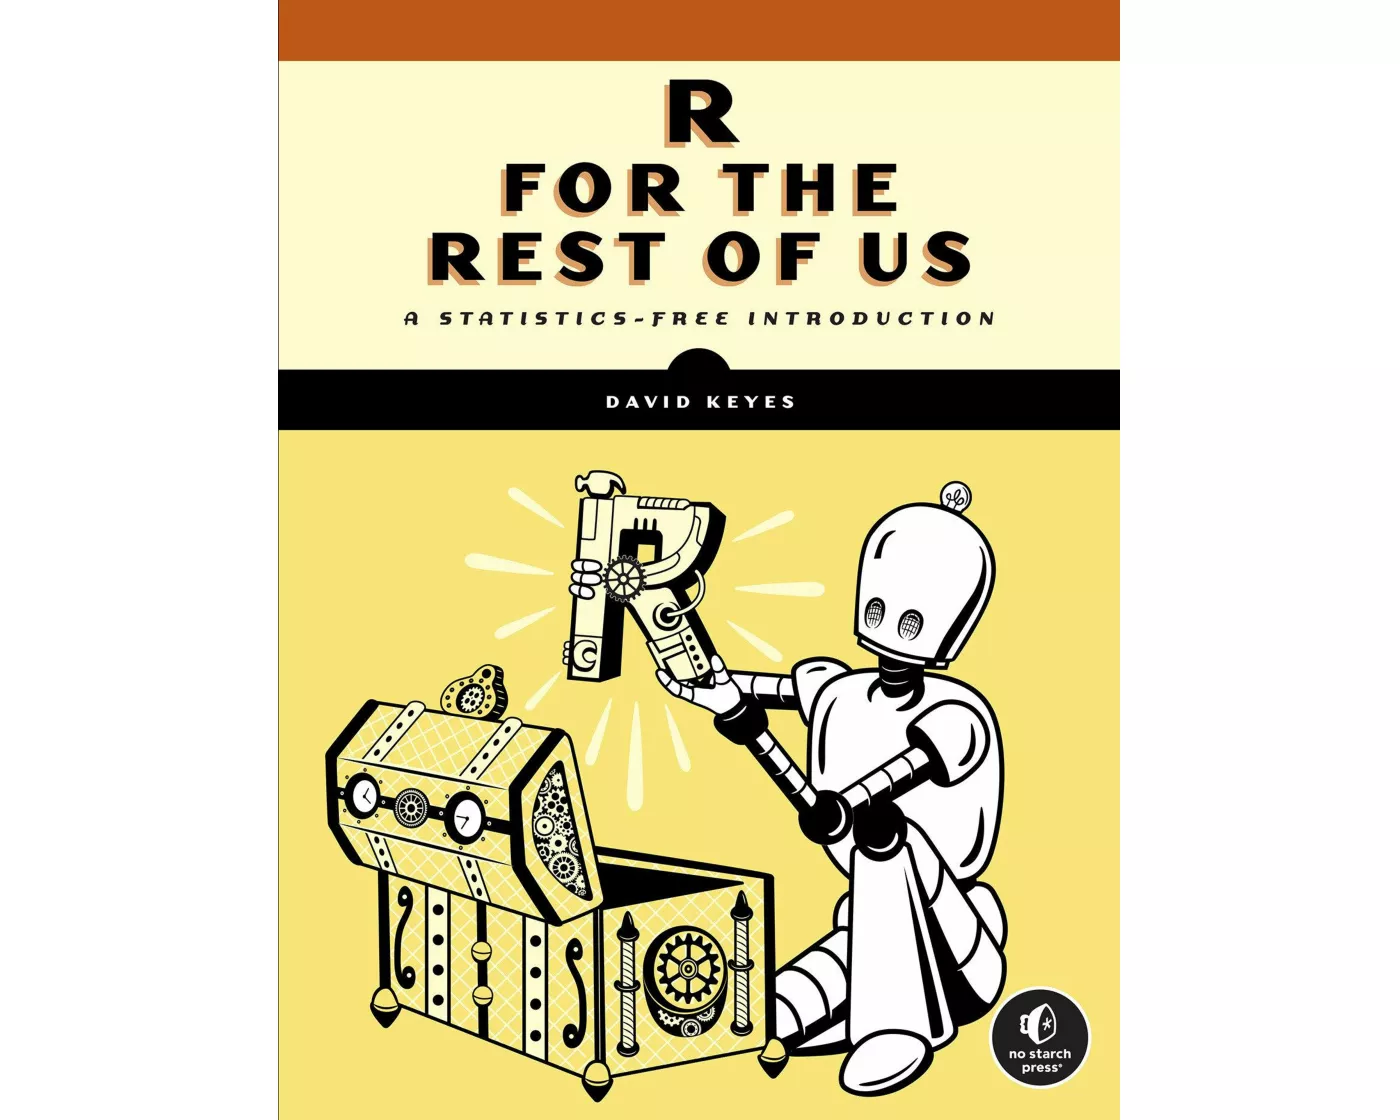
R for the Rest of Us
A Statistics-free Introduction
von Keyes David
- Verlag
- Penguin Random House
- Unsere Artikel-Nr.
- PL5Y84Y
Beschreibung
Learn how to use R for everything from workload automation and creating online reports, to interpreting data, map making, and more. Written by the founder of a very popular online training platform for the R programming language. The R programming language is a remarkably powerful tool for data analysis and visualization, but its steep learning curve can be intimidating for some. If you just want to automate repetitive tasks or visualize your data, without the need for complex math, R for the Rest of Us. is for you. Inside you’ll find a crash course in R, a quick tour of the RStudio programming environment, and a collection of real-word applications that you can put to use right away. You’ll learn how to create informative visualizations, streamline report generation, and develop interactive websites—whether you’re a seasoned R user or have never written a line of R code. You’ll also learn how to: Manipulate, clean, and parse your data with tidyverse packages like dplyr and tidyr to make data science operations more user-friendly Create stunning and customized plots, graphs, and charts with ggplot2 to effectively communicate your data insights Import geospatial data and write code to produce visually appealing maps automatically Generate dynamic reports, presentations, and interactive websites with R Markdown and Quarto that seamlessly integrate code, text, and graphics Develop custom functions and packages tailored to your specific needs, allowing you to extend R’s functionality and automate complex tasksUnlock a treasure trove of techniques to transform the way you work. With R for the Rest of Us. , you’ll discover the power of R to get stuff done. No advanced statistics degree required.
Spezifikationen
| Sprache | Englisch |
|---|---|
| Autor | Keyes David |
| Erscheinungsjahr | 2024 |
| Format | Buch (Softcover) |
| Anzahl Seiten | 256 |
Inhaltsverzeichnis
Introduction
Part 1: Visualizations
Chapter 1: An R Programming Crash Course
Chapter 2: Principles of Data Visualization
Chapter 3: Making Your Own ggplot Theme
Chapter 4: Creating Maps
Chapter 5: Crafting High-Quality Tables
Part 2: Reports, Presentations, and Websites
Chapter 6: Writing Reports in R Markdown
Chapter 7: Using Parameters to Automate Reports
Chapter 8: Making Slideshows with xarigan
Chapter 9: Building Websites with distill
Chapter 10: Reproducible Reporting with Quarto
Part 3: Automation and Collaboration
Chapter 11: Accessing Online Data
Chapter 12: Creating Your Own R Packages
Part 1: Visualizations
Chapter 1: An R Programming Crash Course
Chapter 2: Principles of Data Visualization
Chapter 3: Making Your Own ggplot Theme
Chapter 4: Creating Maps
Chapter 5: Crafting High-Quality Tables
Part 2: Reports, Presentations, and Websites
Chapter 6: Writing Reports in R Markdown
Chapter 7: Using Parameters to Automate Reports
Chapter 8: Making Slideshows with xarigan
Chapter 9: Building Websites with distill
Chapter 10: Reproducible Reporting with Quarto
Part 3: Automation and Collaboration
Chapter 11: Accessing Online Data
Chapter 12: Creating Your Own R Packages
Bewertungen
Produkt bewertenFür dieses Produkt liegt noch keine Bewertung vor. Wenn Sie es gekauft haben, teilen Sie gerne Ihre Erfahrung.
Zahlungsarten


Rechnung (Einzahlungsschein mit QR-Code), Twint, Kreditkarte, PostFinance, Apple, Google oder Samsung Pay.
Versand
Kostenlos: Schweiz & Liechtenstein
Rückgabe
30 Tage Rückgaberecht
Sie können das Produkt innerhalb von 30 Wochentagen ohne Angabe von Gründen zurücksenden, sofern es unbeschädigt und in der Originalverpackung ist.
Weitere Hinweise finden Sie in unseren AGB unter D.1.