
von Stephen Few
- Verlag
- Analytics Press
- Unsere Artikel-Nr.
- Z4EVVQK
Beschreibung
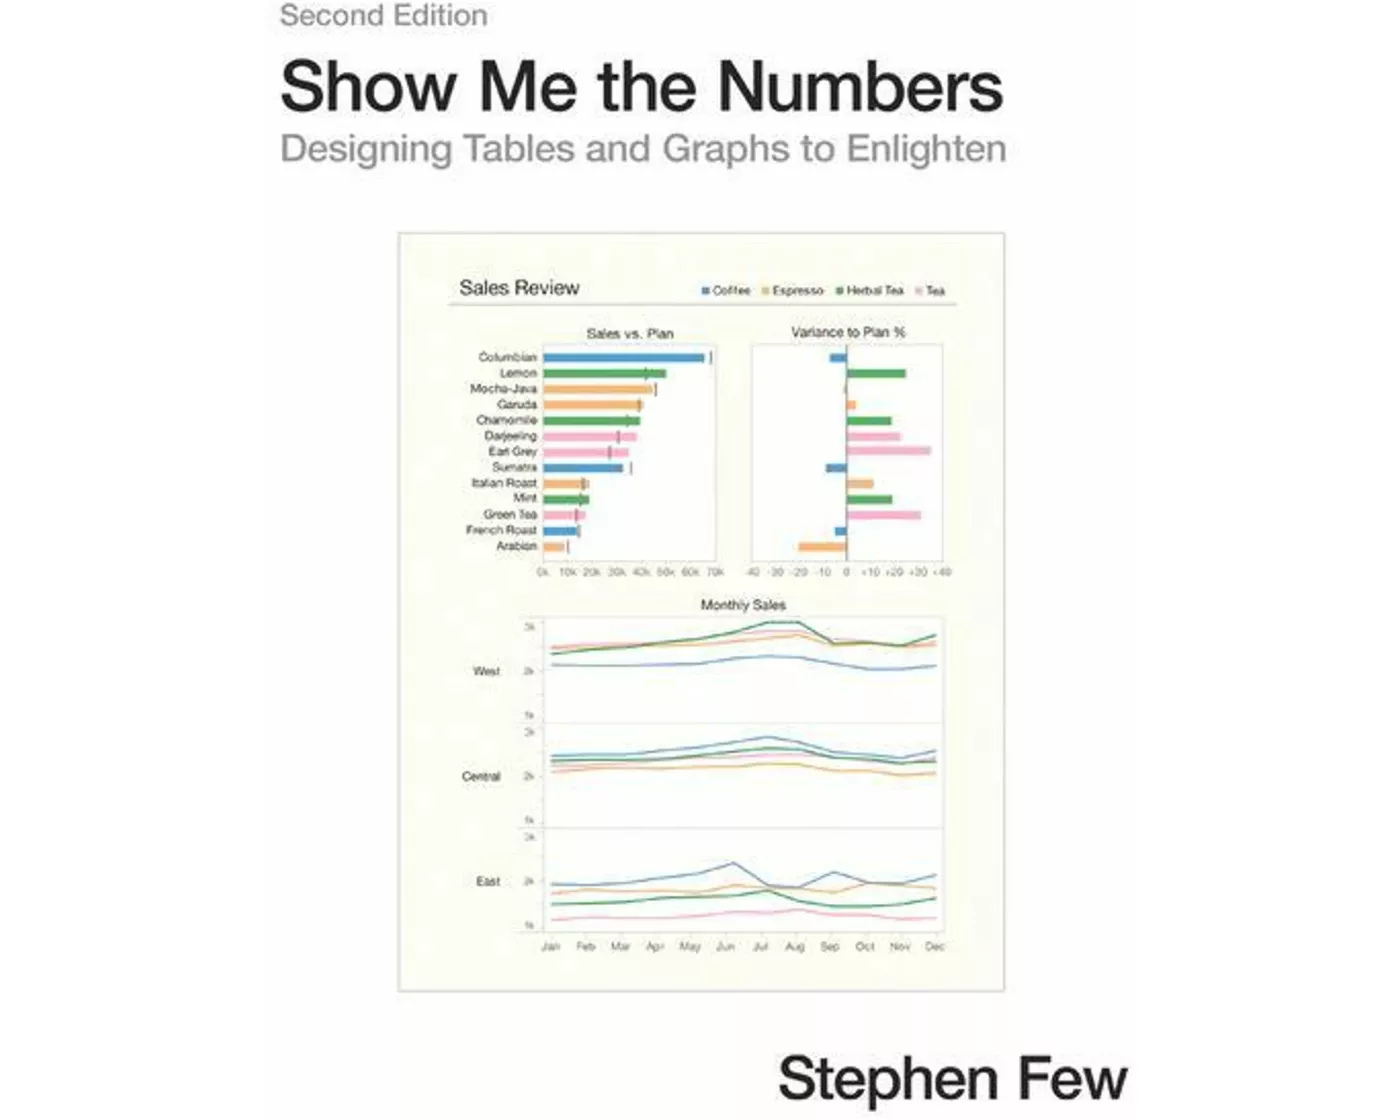
Addressing the prevalent issue of poorly designed quantitative information presentations, this accessible, practical, and comprehensive guide teaches how to properly create tables and graphs for effective and efficient communication. The critical numbers that measure the health, identify the opportunities, and forecast the future of organizations are often misrepresented because few people are trained to design accurate, informative materials, but this manual helps put an end to misinformation. This revised edition of the highly successful book includes updated figures and 91 additional pages of content, including new chapters about quantitative narrative and current misuses of graphs-such as donut, circle, unit, and funnel charts-and new appendices that cover constructing table lens displays and box plots in Excel and useful color palettes for presentation materials.
Spezifikationen
| Sprache | Englisch |
|---|---|
| Autor | Stephen Few |
| Erscheinungsjahr | 2012 |
| Format | Buch (Hardcover) |
| Anzahl Seiten | 371 |
Bewertungen
Produkt bewertenFür dieses Produkt liegt noch keine Bewertung vor. Wenn Sie es gekauft haben, teilen Sie gerne Ihre Erfahrung.
Zahlungsarten


Rechnung (Einzahlungsschein mit QR-Code), Twint, Kreditkarte, PostFinance, Apple, Google oder Samsung Pay.
Versand
Kostenlos: Schweiz & Liechtenstein
Rückgabe
Kein Rückgaberecht
Bei diesem Produkt hat entweder der Hersteller/Verlag das Rückgaberecht ausgeschlossen oder eine Rückgabe ist aufgrund des Vertriebssystems nicht möglich.