
Erhältlich:Nicht auf LagerBuch (Softcover): Fachbuch
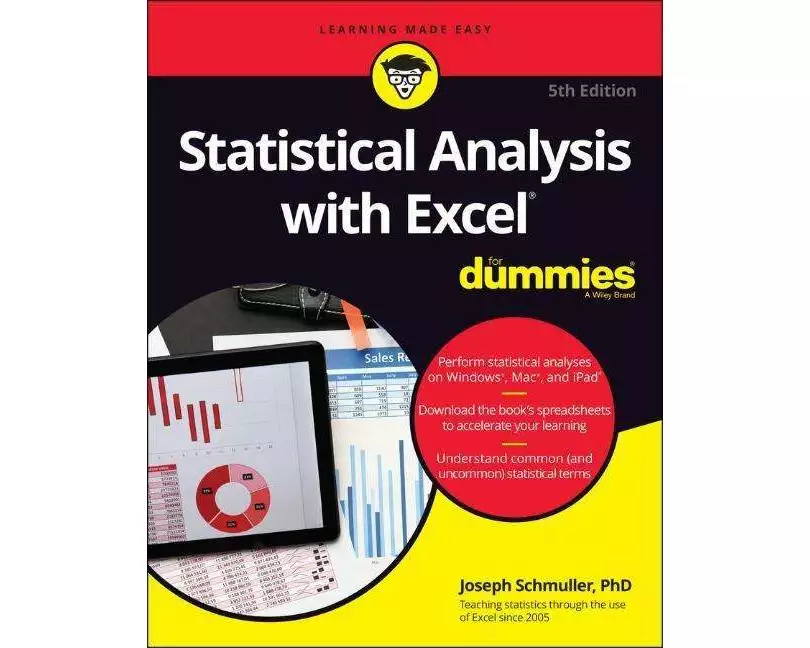
Statistical Analysis with Excel For Dummies
von Joseph Schmuller
- Verlag
- John Wiley & Sons
- Unsere Artikel-Nr.
- 3Y3EPVP
Beschreibung
Become a stats superstar by using Excel to reveal the powerful secrets of statistics Microsoft Excel offers numerous possibilities for statistical analysis-and you don't have to be a math wizard to unlock them. In Statistical Analysis with Excel For Dummies, fully updated for the 2021 version of Excel, you'll hit the ground running with straightforward techniques and practical guidance to unlock the power of statistics in Excel. Bypass unnecessary jargon and skip right to mastering formulas, functions, charts, probabilities, distributions, and correlations. Written for professionals and students without a background in statistics or math, you'll learn to create, interpret, and translate statistics-and have fun doing it. In this book you'll find out how to: Understand, describe, and summarize any kind of data, from sports stats to sales figures Confidently draw conclusions from your analyses, make accurate predictions, and calculate correlations Model the probabilities of future outcomes based on past data Perform statistical analysis on any platform: Windows, Mac, or iPad Access additional resources and practice templates through Dummies. com For anyone who's ever wanted to unleash the full potential of statistical analysis in Excel-and impress your colleagues or classmates along the way-Statistical Analysis with Excel For Dummies walks you through the foundational concepts of analyzing statistics and the step-by-step methods you use to apply them.
Spezifikationen
| Sprache | Englisch |
|---|---|
| Autor | Joseph Schmuller |
| Thema | PC/Internet: Unternehmensanwendungen |
| Auflage | 5 |
| Erscheinungsjahr | 2022 |
| Format | Buch (Softcover) |
| Anzahl Seiten | 576 |
Inhaltsverzeichnis
"Introduction 1\n\nAbout This Book 2\n\nWhat's New in This Edition 2\n\nWhat's New in Excel (Microsoft 365) 3\n\nFoolish Assumptions 3\n\nIcons Used in This Book 4\n\nWhere to Go from Here 5\n\nBeyond This Book 5\n\nPart 1: Getting Started With Statistical Analysis With Excel: A Marriage Made In Heaven 7\n\nChapter 1: Evaluating Data in the Real World 9\n\nThe Statistical (and Related) Notions You Just Have to Know 9\n\nSamples and populations 10\n\nVariables: Dependent and independent 11\n\nTypes of data 12\n\nA little probability 13\n\nInferential Statistics: Testing Hypotheses 14\n\nNull and alternative hypotheses 15\n\nTwo types of error 16\n\nSome Excel Fundamentals 18\n\nAutofilling cells 22\n\nReferencing cells 25\n\nChapter 2: Understanding Excel's Statistical Capabilities 29\n\nGetting Started 30\n\nSetting Up for Statistics 32\n\nWorksheet functions 32\n\nQuickly accessing statistical functions 36\n\nArray functions 38\n\nWhat's in a name? An array of possibilities 41\n\nCreating Your Own Array Formulas 50\n\nUsing data analysis tools 51\n\nAdditional data analysis tool packages 56\n\nAccessing Commonly Used Functions 58\n\nThe New Analyze Data Tool 59\n\nData from Pictures! 60\n\nPart 2: Describing Data 63\n\nChapter 3: Show-and-Tell: Graphing Data 65\n\nWhy Use Graphs? 65\n\nExamining Some Fundamentals 67\n\nGauging Excel's Graphics (Chartics?) Capabilities 68\n\nBecoming a Columnist 69\n\nStacking the Columns 73\n\nSlicing the Pie 74\n\nA word from the wise 76\n\nDrawing the Line 77\n\nAdding a Spark 80\n\nPassing the Bar 82\n\nThe Plot Thickens 84\n\nFinding Another Use for the Scatter Chart 88\n\nChapter 4: Finding Your Center 91\n\nMeans: The Lore of Averages 91\n\nCalculating the mean 92\n\nAVERAGE and AVERAGEA 93\n\nAVERAGEIF and AVERAGEIFS 95\n\nTRIMMEAN 99\n\nOther means to an end 100\n\nMedians: Caught in the Middle 102\n\nFinding the median 102\n\nMEDIAN 103\n\nStatistics \u00e0 la Mode 104\n\nFinding the mode 104\n\nMODE.SNGL and MODE.MULT 104\n\nChapter 5: Deviating from the Average 107\n\nMeasuring Variation 108\n\nAveraging squared deviations: Variance and how to calculate it 108\n\nVAR.P and VARPA 111\n\nSample variance 113\n\nVAR.S and VARA 114\n\nBack to the Roots: Standard Deviation 114\n\nPopulation standard deviation 115\n\nSTDEV.P and STDEVPA 115\n\nSample standard deviation 116\n\nSTDEV.S and STDEVA 116\n\nThe missing functions: STDEVIF and STDEVIFS 117\n\nRelated Functions 121\n\nDEVSQ 121\n\nAverage deviation 122\n\nAVEDEV 123\n\nChapter 6: Meeting Standards and Standings 125\n\nCatching Some Z's 126\n\nCharacteristics of z-scores 126\n\nBonds versus the Bambino 127\n\nExam scores 128\n\nSTANDARDIZE 128\n\nWhere Do You Stand? 131\n\nRANK.EQ and RANK.AVG 131\n\nLARGE and SMALL 133\n\nPERCENTILE.INC and PERCENTILE.EXC 134\n\nPERCENTRANK.INC and PERCENTRANK.EXC 137\n\nData analysis tool: Rank and Percentile 138\n\nChapter 7: Summarizing It All 141\n\nCounting Out 141\n\nCOUNT, COUNTA, COUNTBLANK, COUNTIF, COUNTIFS 141\n\nThe Long and Short of It 144\n\nMAX, MAXA, MIN, and MINA 144\n\nGetting Esoteric 145\n\nSKEW and SKEW.P 146\n\nKURT 148\n\nTuning In the Frequency 150\n\nFREQUENCY 150\n\nData analysis tool: Histogram 152\n\nCan You Give Me a Description? 154\n\nData analysis tool: Descriptive Statistics 154\n\nBe Quick About It! 156\n\nInstant Statistics 159\n\nChapter 8: What's Normal? 161\n\nHitting the Curve 161\n\nDigging deeper 162\n\nParameters of a normal distribution 163\n\nNORM.DIST 165\n\nNORM.INV 167\n\nA Distinguished Member of the Family 168\n\nNORM.S.DIST 169\n\nNORM.S.INV 170\n\nPHI and GAUSS 170\n\nGraphing a Standard Normal Distribution 171\n\nPart 3: Drawing Conclusions From Data 173\n\nChapter 9: The Confidence Game: Estimation 175\n\nUnderstanding Sampling Distributions 176\n\nAn EXTREMELY Important Idea: The Central Limit Theorem 177\n\n(Approximately) simulating the Central Limit Theorem 178\n\nThe Limits of Confidence 183\n\nFinding confidence limits for a mean 183\n\nCONFIDENCE.NORM 186\n\nFit to a t 187\n\nCONFIDENCE.T 188\n\nChapter 10: One-Sample Hypothesis Testing 189\n\nHypotheses, Tests, and Errors 190\n\nHypothesis Tests and Sampling Distributions 191\n\nCatching Some Z's Again 193\n\nZ.TEST 196\n\nt for One 197\n\nT.DIST, T.DIST.RT, and T.DIST.2T 198\n\nT.INV and T.INV.2T 200\n\nVisualizing a t-Distribution 201\n\nTesting a Variance 203\n\nCHISQ.DIST and CHISQ.DIST.RT 205\n\nCHISQ.INV and CHISQ.INV.RT 206\n\nVisualizing a Chi-Square Distribution 208\n\nChapter 11: Two-Sample Hypothesis Testing 211\n\nHypotheses Built for Two 211\n\nSampling Distributions Revisited 212\n\nApplying the Central Limit Theorem 213\n\nZ's once more 215\n\nData analysis tool: z-Test: Two Sample for Means 216\n\nt for Two 219\n\nLike peas in a pod: Equal variances 220\n\nLike p's and q's: Unequal variances 221\n\nT.TEST 222\n\nData analysis tool: t-Test: Two Sample 223\n\nA Matched Set: Hypothesis Testing for Paired Samples 227\n\nT.TEST for matched samples 228\n\nData analysis tool: t-Test: Paired Two Sample for Means 230\n\nt-tests on the iPad with StatPlus 232\n\nTesting Two Variances 235\n\nUsing F in conjunction with t 237\n\nF.TEST 238\n\nF.DIST and F.DIST.RT 240\n\nF.INV and F.INV.RT 241\n\nData analysis tool: F-test: Two Sample for Variances 242\n\nVisualizing the F-Distribution 244\n\nChapter 12: Testing More Than Two Samples 247\n\nTesting More than Two 247\n\nA thorny problem 248\n\nA solution 249\n\nMeaningful relationships 253\n\nAfter the F-test 254\n\nData analysis tool: Anova: Single Factor 258\n\nComparing the means 260\n\nAnother Kind of Hypothesis, Another Kind of Test 262\n\nWorking with repeated measures ANOVA 262\n\nGetting trendy 264\n\nData analysis tool: Anova: Two-Factor Without Replication 268\n\nAnalyzing trend 271\n\nANOVA on the iPad 272\n\nANOVA on the iPad: Another Way 274\n\nRepeated Measures ANOVA on the iPad 277\n\nChapter 13: Slightly More Complicated Testing 281\n\nCracking the Combinations 281\n\nBreaking down the variances 282\n\nData analysis tool: Anova: Two-Factor Without Replication 284\n\nCracking the Combinations Again 286\n\nRows and columns 286\n\nInteractions 287\n\nThe analysis 288\n\nData analysis tool: Anova: Two-Factor With Replication 289\n\nTwo Kinds of Variables -- at Once 292\n\nUsing Excel with a Mixed Design 293\n\nGraphing the Results 298\n\nAfter the ANOVA 300\n\nTwo-Factor ANOVA on the iPad 300\n\nChapter 14: Regression: Linear and Multiple 303\n\nThe Plot of Scatter 303\n\nGraphing a line 305\n\nRegression: What a Line! 307\n\nUsing regression for forecasting 309\n\nVariation around the regression line 309\n\nTesting hypotheses about regression 311\n\nWorksheet Functions for Regression 317\n\nSLOPE, INTERCEPT, STEYX 318\n\nFORECAST.LINEAR 319\n\nArray function: TREND 319\n\nArray function: LINEST 323\n\nData Analysis Tool: Regression 325\n\nWorking with tabled output 327\n\nOpting for graphical output 329\n\nJuggling Many Relationships at Once: Multiple Regression 330\n\nExcel Tools for Multiple Regression 331\n\nTREND revisited 331\n\nLINEST revisited 333\n\nRegression data analysis tool revisited 336\n\nRegression Analysis on the iPad 338\n\nChapter 15: Correlation: The Rise and Fall of Relationships 341\n\nScatterplots Again 341\n\nUnderstanding Correlation 342\n\nCorrelation and Regression 345\n\nTesting Hypotheses about Correlation 347\n\nIs a correlation coefficient greater than zero? 348\n\nDo two correlation coefficients differ? 349\n\nWorksheet Functions for Correlation 350\n\nCORREL and PEARSON 350\n\nRSQ 351\n\nCOVARIANCE.P and COVARIANCE.S 352\n\nData Analysis Tool: Correlation 353\n\nTabled output 354\n\nMultiple correlation 355\n\nPartial correlation 356\n\nSemipartial correlation 357\n\nData Analysis Tool: Covariance 358\n\nUsing Excel to Test Hypotheses about Correlation 358\n\nWorksheet functions: FISHER, FISHERINV 359\n\nCorrelation Analysis on the iPad 360\n\nChapter 16: It's About Time 363\n\nA Series and Its Components 363\n\nA Moving Experience 364\n\nLining up the trend 365\n\nData analysis tool: Moving Average 365\n\nHow to Be a Smoothie, Exponentially 368\n\nOne-Click Forecasting 369\n\nWorking with Time Series on the iPad 374\n\nChapter 17: Nonparametric Statistics 379\n\nIndependent Samples 380\n\nTwo samples: Mann-Whitney U test 380\n\nMore than two samples: Kruskal-Wallis one-way ANOVA 382\n\nMatched Samples 383\n\nTwo samples: Wilcoxon matched-pairs signed ranks 384\n\nMore than two samples: Friedman two-way ANOVA 386\n\nMore than two samples: Cochran's Q 387\n\nCorrelation: Spearman's rS 389\n\nA Heads-Up 391\n\nPart 4: Probability 393\n\nChapter 18: Introducing Probability 395\n\nWhat Is Probability? 395\n\nExperiments, trials, events, and sample spaces 396\n\nSample spaces and probability 396\n\nCompound Events 397\n\nUnion and intersection 397\n\nIntersection, again 398\n\nConditional Probability 399\n\nWorking with the probabilities 400\n\nThe foundation of hypothesis testing 400\n\nLarge Sample Spaces 400\n\nPermutations 401\n\nCombinations 402\n\nWorksheet Functions 403\n\nFACT 403\n\nPERMUT and PERMUTIONA 403\n\nCOMBIN and COMBINA 404\n\nRandom Variables: Discrete and Continuous 405\n\nProbability Distributions and Density Functions 405\n\nThe Binomial Distribution 407\n\nWorksheet Functions 409\n\nBINOM.DIST and BINOM.DIST.RANGE 409\n\nNEGBINOM.DIST 411\n\nHypothesis Testing with the Binomial Distribution 412\n\nBINOM.INV 413\n\nMore on hypothesis testing 414\n\nThe Hypergeometric Distribution 415\n\nHYPGEOM.DIST 416\n\nChapter 19: More on Probability 419\n\nDiscovering Beta 419\n\nBETA.DIST 421\n\nBETA.INV 423\n\nPoisson 424\n\nPOISSON.DIST 425\n\nWorking with Gamma 427\n\nThe gamma function and GAMMA 427\n\nThe gamma distribution and GAMMA.DIST 428\n\nGAMMA.INV 430\n\nExponential 431\n\nEXPON.DIST 431\n\nChapter 20: Using Probability: Modeling and Simulation 433\n\nModeling a Distribution 434\n\nPlunging into the Poisson distribution 434\n\nVisualizing the Poisson distribution 435\n\nWorking with the Poisson distribution 436\n\nUsing POISSON.DIST again 437\n\nTesting the model's fit 437\n\nA word about CHISQ.TEST 440\n\nPlaying ball with a model 441\n\nA Simulating Discussion 444\n\nTaking a chance: The Monte Carlo method 444\n\nLoading the dice 444\n\nData analysis tool: Random Number Generation 445\n\nSimulating the Central limit Theorem 448\n\nSimulating a business 452\n\nChapter 21: Estimating Probability: Logistic Regression 457\n\nWorking Your Way Through Logistic Regression 458\n\nMining with XLMiner 460\n\nPart 5: The Part of Tens 465\n\nChapter 22: Ten (12, Actually) Statistical and Graphical Tips and Traps 467\n\nSignificant Doesn't Always Mean Important 467\n\nTrying to Not Reject a Null Hypothesis Has a Number of Implications 468\n\nRegression Isn't Always Linear 468\n\nExtrapolating Beyond a Sample Scatterplot Is a Bad Idea 469\n\nExamine the Variability Around a Regression Line 469\n\nA Sample Can Be Too Large 470\n\nConsumers: Know Your Axes 470\n\nGraphing a Categorical Variable as a Quantitative Variable Is Just Plain Wrong 471\n\nWhenever Appropriate, Include Variability in Your Graph 472\n\nBe Careful When Relating Statistics Textbook Concepts to Excel 472\n\nIt's Always a Good Idea to Use Named Ranges in Excel 472\n\nStatistical Analysis with Excel on the iPad Is Pretty Good! 473\n\nChapter 23: Ten Topics (Thirteen, Actually) That Just Don't Fit Elsewhere 475\n\nGraphing the Standard Error of the Mean 475\n\nProbabilities and Distributions 479\n\nPROB 479\n\nWEIBULL.DIST 479\n\nDrawing Samples 480\n\nTesting Independence: The True Use of CHISQ.TEST 481\n\nLogarithmica Esoterica 484\n\nWhat is a logarithm? 484\n\nWhat is e? 486\n\nLOGNORM.DIST 489\n\nLOGNORM.INV 490\n\nArray Function: LOGEST 491\n\nArray Function: GROWTH 494\n\nThe logs of Gamma 497\n\nSorting Data 498\n\nPart 6: Appendices 501\n\nAppendix A: When Your Data Live Elsewhere 503\n\nAppendix B: Tips for Teachers (and Learners) 507\n\nAugmenting Analyses Is a Good Thing 507\n\nUnderstanding ANOVA 508\n\nRevisiting regression 510\n\nSimulating Data Is Also a Good Thing 512\n\nWhen All You Have Is a Graph 514\n\nAppendix C: More on Excel Graphics 515\n\nTasting the Bubbly 515\n\nTaking Stock 516\n\nScratching the Surface 518\n\nOn the Radar 519\n\nGrowing a Treemap and Bursting Some Sun 520\n\nBuilding a Histogram 521\n\nOrdering Columns: Pareto 522\n\nOf Boxes and Whiskers 523\n\n3D Maps 524\n\nFilled Maps 527\n\nAppendix D: The Analysis of Covariance 529\n\nCovariance: A Closer Look 529\n\nWhy You Analyze Covariance 530\n\nHow You Analyze Covariance 531\n\nANCOVA in Excel 532\n\nMethod 1: ANOVA 533\n\nMethod 2: Regression 537\n\nAfter the ANCOVA 540\n\nAnd One More Thing 542\n\nIndex 545"
Bewertungen
Produkt bewertenFür dieses Produkt liegt noch keine Bewertung vor. Wenn Sie es gekauft haben, teilen Sie gerne Ihre Erfahrung.
Zahlungsarten


Rechnung (Einzahlungsschein mit QR-Code), Twint, Kreditkarte, PostFinance, Apple, Google oder Samsung Pay.
Versand
Kostenlos: Schweiz & Liechtenstein
Rückgabe
30 Tage Rückgaberecht
Sie können das Produkt innerhalb von 30 Wochentagen ohne Angabe von Gründen zurücksenden, sofern es unbeschädigt und in der Originalverpackung ist.
Weitere Hinweise finden Sie in unseren AGB unter D.1.