
Auf Lager:2Buch (Softcover): Fachbuch
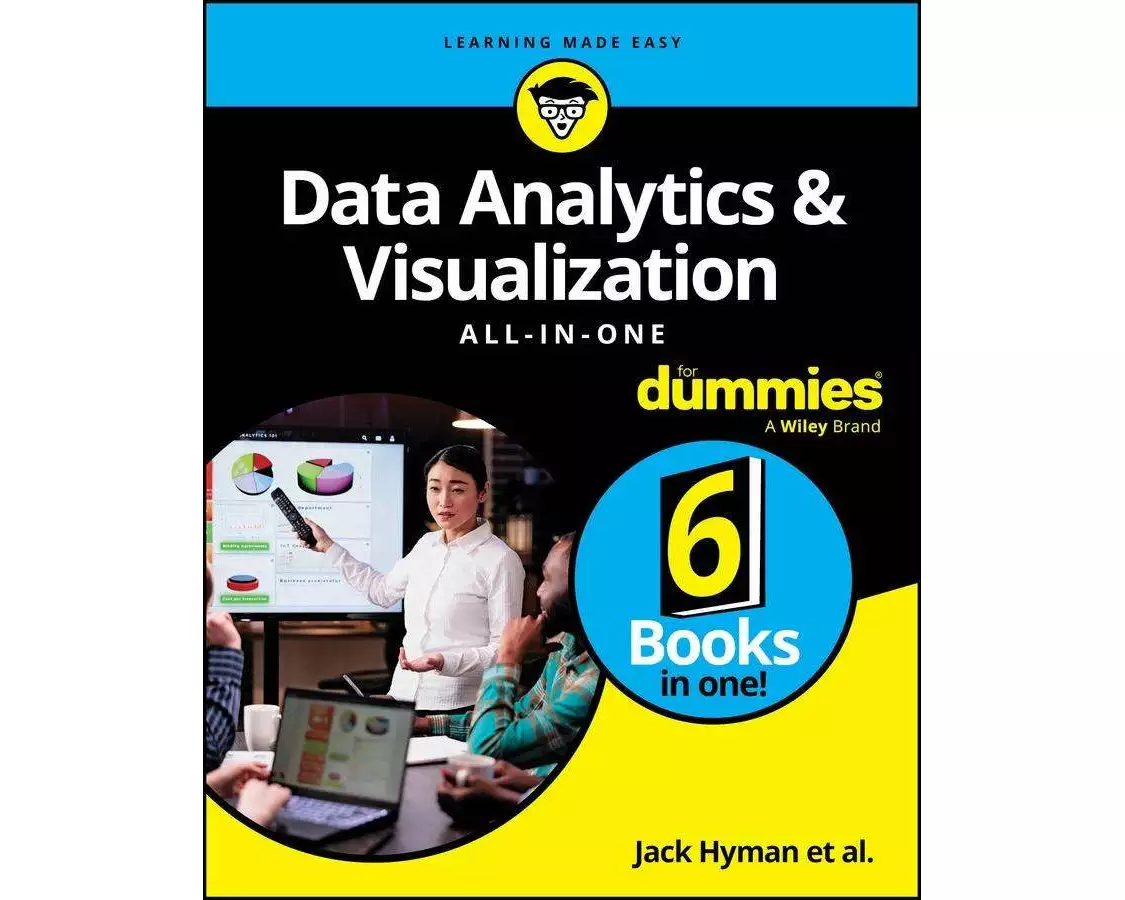
Data Analytics & Visualization All-In-One for Dummies
von Joseph Schmuller, Luca Massaron, Paul McFedries
- Verlag
- John Wiley & Sons
- Unsere Artikel-Nr.
- 99LNYGV
Beschreibung
Unravel mysteries and tell stories with data. The world of data analytics requires having a grasp of statistics, visualization tools, business intelligence, and coding. For aspiring data analysts, it's a lot to figure out on the fly. This book provides a trusty guide for getting a handle on the fundamentals of data. Discover how to dig data out of storage, how to extrapolate insight from it, and how to turn that insight into a story that inspires others. It's all in a day's work for a data analyst. 6 Mini-Books Inside. Learning Data Analytics & Visualization Foundations. Using Power BI for Data Analytics & Visualization. Using Tableau for Data Analytics & Visualization. Extracting Information with SQL. Performing Statistical Data Analysis & Visualization with R Programming. Applying Python Programming to Data Science.
Spezifikationen
| Sprache | Englisch |
|---|---|
| Autor | Joseph Schmuller, Luca Massaron, Paul McFedries, John Paul Mueller, Jack A. Hyman, Lillian Pierson, Allen G. Taylor, Jonathan Reichental, Alan R. Simon |
| Erscheinungsjahr | 2024 |
| Format | Buch (Softcover) |
| Anzahl Seiten | 832 |
Inhaltsverzeichnis
Introduction 1
Book 1: Learning Data Analytics & Visualizations Foundations 7
Chapter 1: Exploring Definitions and Roles 9
Chapter 2: Delving into Big Data 19
Chapter 3: Understanding Data Lakes 41
Chapter 4: Wrapping Your Head Around Data Science 51
Chapter 5: Telling Powerful Stories with Data Visualization 81
Book 2: Using Power BI for Data Analytics & Visualization 107
Chapter 1: Power BI Foundations 109
Chapter 2: The Quick Tour of Power BI 123
Chapter 3: Prepping Data for Visualization 141
Chapter 4: Tweaking Data for Primetime 167
Chapter 5: Designing and Deploying Data Models 183
Chapter 6: Tackling Visualization Basics in Power BI 203
Chapter 7: Digging into Complex Visualization and Table Data 227
Chapter 8: Sharing and Collaborating with Power BI 247
Book 3: Using Tableau for Data Analytics & Visualization 265
Chapter 1: Tableau Foundations 267
Chapter 2: Connecting Your Data 285
Chapter 3: Diving into the Tableau Prep Lifecycle 313
Chapter 4: Advanced Data Prep Approaches in Tableau 337
Chapter 5: Touring Tableau Desktop 351
Chapter 6: Storytelling Foundations in Tableau 371
Chapter 7: Visualizing Data in Tableau 391
Chapter 8: Collaborating and Publishing with Tableau Cloud 425
Book 4: Extracting Information with SQL 443
Chapter 1: SQL Foundations 445
Chapter 2: Drilling Down to the SQL Nitty-Gritty 455
Chapter 3: Values, Variables, Functions, and Expressions 487
Chapter 4: SELECT Statements and Modifying Clauses 513
Chapter 5: Tuning Queries 539
Chapter 6: Complex Query Design 557
Chapter 7: Joining Data Together in SQL 591
Book 5: Performing Statistical Data Analysis & Visualization with R Programming 605
Chapter 1: Using Open Source R for Data Science 607
Chapter 2: R: What It Does and How It Does It 623
Chapter 3: Getting Graphical 651
Chapter 4: Kicking It Up a Notch to ggplot2 671
Book 6: Applying Python Programming to Data Science 689
Chapter 1: Discovering the Match between Data Science and Python 691
Chapter 2: Using Python for Data Science and Visualization 703
Chapter 3: Getting a Crash Course in Matplotlib 721
Chapter 4: Visualizing the Data 739
Index 761
Bewertungen
Produkt bewertenFür dieses Produkt liegt noch keine Bewertung vor. Wenn Sie es gekauft haben, teilen Sie gerne Ihre Erfahrung.
Zahlungsarten


Rechnung (Einzahlungsschein mit QR-Code), Twint, Kreditkarte, PostFinance, Apple, Google oder Samsung Pay.
Versand
Kostenlos: Schweiz & Liechtenstein
Rückgabe
30 Tage Rückgaberecht
Sie können das Produkt innerhalb von 30 Wochentagen ohne Angabe von Gründen zurücksenden, sofern es unbeschädigt und in der Originalverpackung ist.
Weitere Hinweise finden Sie in unseren AGB unter D.1.